THE FALCONN JOURNAL TOOLKIT

See the trade.
Understand
the trader.

Connect the plan you made, the trades you took and the habits behind the result. Fifteen ways to see your trading more clearly.

Built for the work before, during and after a session.
YOUR PROCESS, IN PERSPECTIVEFlight Path
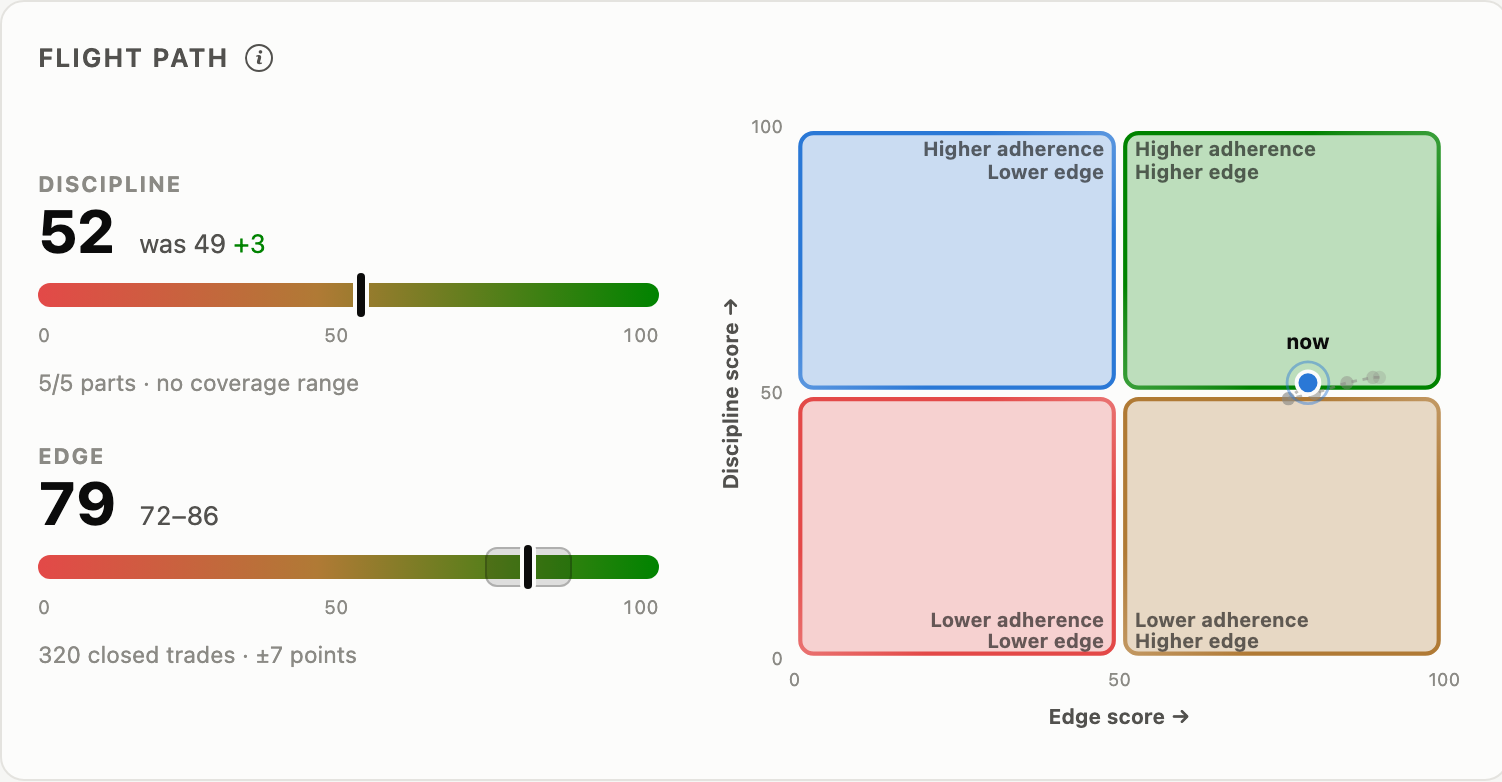
Actual Falconn Journal Flight Path: discipline 52, edge 79 with a 72–86 range, and the current position on the edge-versus-discipline plot.

Actual Journal screen · captured 17 September 2026. Click to enlarge.

01
Before the open

Write the playbook. Define your risk.

02
Understand your book

Read results with their context.

03
After the close

Review the decisions. Carry a lesson forward.

A CLOSER LOOK

Find the tools for your next question.

Visual explanations, practical context and actual Journal screens. Pick a part of your routine to explore.

Jump to a feature
Flight PathStrategy playbooksPerformance analyticsTrade & session reviewsEdge × disciplineOptions analyticsSession planningCapital & risk limitsExecution diagnosticsTrading cost analysisStrategy comparisonEdge decay analysisWhat-if LabMultiple accounts & exportWeekly review

Showing all 15 features

01 / Flight Path#
Actual Flight Path panel showing discipline 52, edge 79, its uncertainty range and the quadrant trail.Actual Journal screen · click to enlarge

See the direction of your trading.

Track edge and discipline as separate dimensions. Follow the trail across sessions to see how your results and your process change together.

In your review

Read the trail over time, with the score’s uncertainty in view. A single session is only one point.
View app screen
02 / Strategy playbooks#
YOUR PLAYBOOKEntryWhat makes the setup valid?RiskWhere is the idea invalidated?ExitWhat is the plan for taking profit?DraftTestPaperLiveRevisit ↺Feature illustration

Give every setup a written standard.

Define entry, stop, target, session and skip rules. Keep revisions and stage changes beside the strategy, from testing through paper and live trading.

In your review

Review a trade against the rules you actually wrote, then revisit the playbook with evidence.

View app screen
03 / Performance analytics#
LOOK AT THE SAME BOOK FROM DIFFERENT ANGLESEntry timeHolding timeDaily trade countTrade orderFeature illustration

Find the patterns behind the headline.

Move from a graphical overview to results by entry time, holding time, daily trade count and trade order. Keep the current filters and sample sizes in view.

In your review

Look for a pattern across enough trades before deciding that one time window or habit deserves more attention.

View app screen
04 / Trade & session reviews#
THE RESULT IS ONLY THE START✓Notes, grade and setup tags✓Screenshots beside the trade✓One commitment for the next sessionReview → next planFeature illustration

Keep the reason beside the result.

Add notes, grades, setup tags and screenshots to your review. Record what went well, what drifted from the plan and one commitment to carry into the next session.

In your review

Review the decision while the context is fresh. Give the next session a specific lesson to start from.

View app screen
05 / Edge × discipline#
EDGEDISCIPLINEDoes the plan pay?Did I follow it?Expectancy + uncertaintyRules kept + coverageFeature illustration

Separate a good process from a lucky result.

Read strategy expectancy and its uncertainty range beside rule adherence. See how often you followed the plan and what off-plan trades contributed.

In your review

Ask both questions: did the plan pay, and did you follow it? A profitable trade alone cannot answer the second.

View app screen
06 / Options analytics#
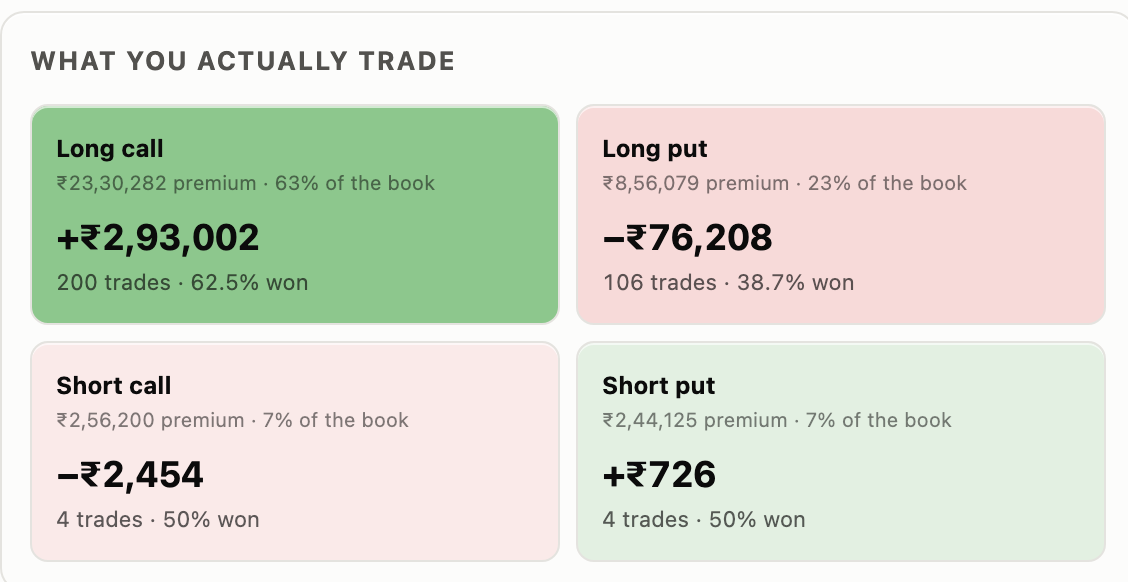
Actual What you actually trade card showing long and short calls and puts, premium, net results, trade counts and win rates.Actual Journal screen · click to enlarge

See the shape of your options book.

Separate bought and sold calls and puts. Explore results by underlying, expiry distance, entry premium and holding time, with trade counts alongside the numbers.

In your review

Compare like with like. A result concentrated in one contract type can disappear inside the overall total.

View app screen
07 / Session planning#
BEFORE THE OPENAFTER THE CLOSEWatchlistInstruments tradedSetups + riskTrades + actual riskSession limitsPlan vs. actual→Feature illustration

Write the plan before the open.

Prepare a watchlist, intended setups and session risk. Reuse templates, then compare the plan with the instruments, trades and risk you actually took.

In your review

Make the plan concrete enough to review after the close: what you intended, what happened and what changed.

View app screen
08 / Capital & risk limits#
YOUR RECORDED CAPITALOpening balance + cash flows + closed resultsPer-trade riskYour stated exposureDaily loss limitYour session boundaryTrade-count capYour limit on activityDated limits→Each day keeps its original referenceFeature illustration

Put your own boundaries in writing.

Record capital and define per-trade risk, a daily loss line and a trade-count cap. Review historical sessions against the limits that applied at the time.

In your review

These are review boundaries. The journal does not place orders, block trades or close positions for you.

View app screen
09 / Execution diagnostics#
COMPARE THE EXIT WITH THE ORIGINAL PLANTargetEntryStopEarly exitLoss beyond planned riskFeature illustration

Find where execution changed the outcome.

Review early exits, target capture, losses beyond planned risk and sizing after a loss. Connect the eventual result to the stop and target recorded in the plan.

In your review

Use recurring exit patterns to guide your next review. Risk-based measures need a recorded risk plan.

View app screen
10 / Trading cost analysis#
FOLLOW THE RESULT THROUGH THE CHARGESGrossChargesNetModelledestimatesFeature illustration

Follow gross results through to net.

See how modelled charges affect your results and compare their impact across strategies. Read the estimated cost per trade alongside the activity that generated it.

In your review

Charges are estimates, not values read from your contract note. Use the labels and coverage to understand the calculation.

View app screen
11 / Strategy comparison#
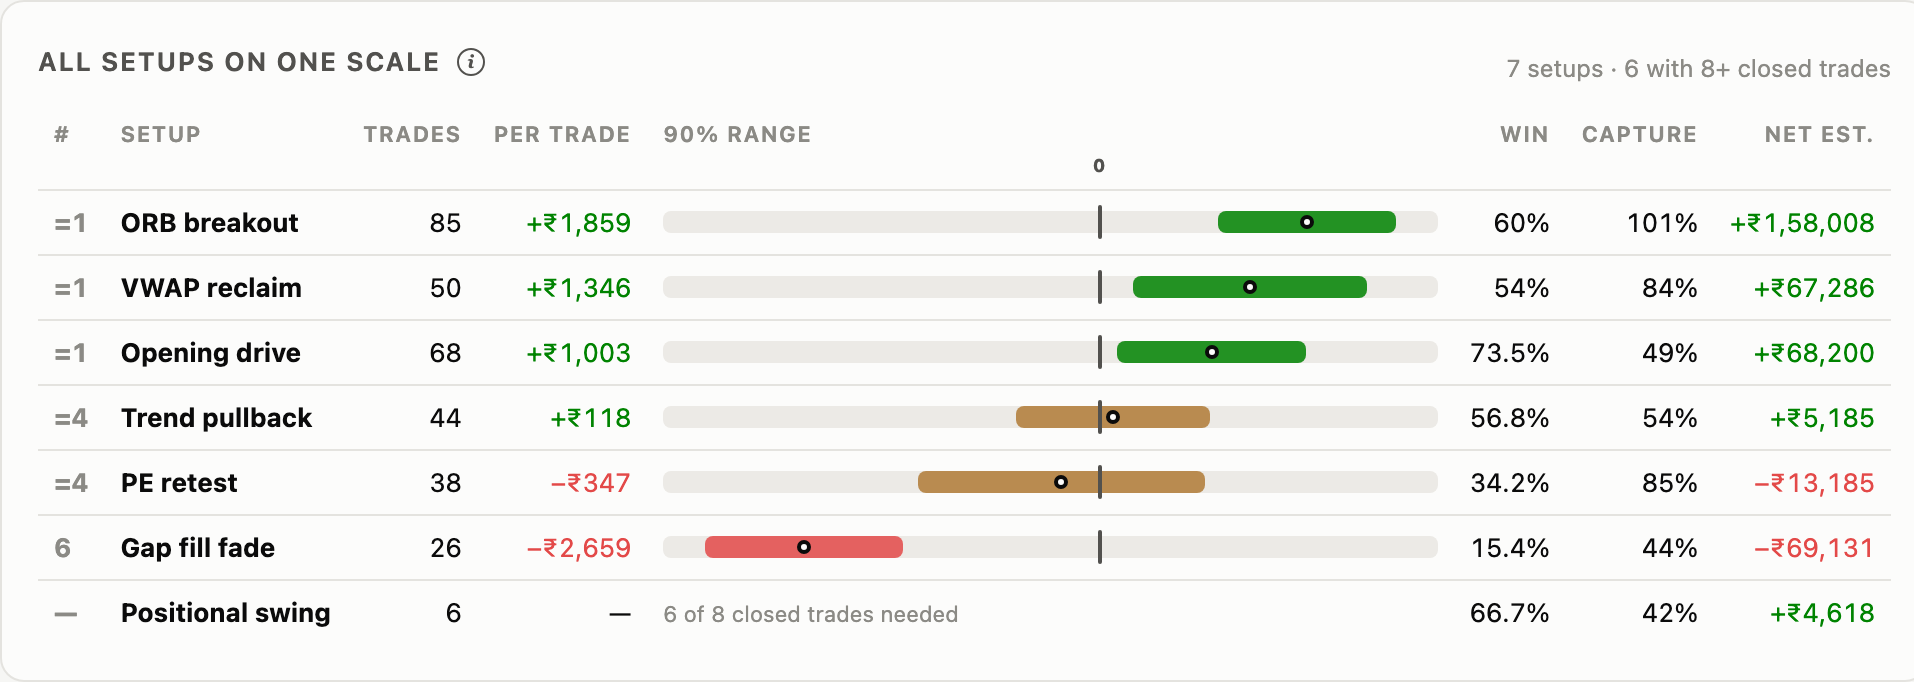
Actual Performance screen comparing seven setups by trade count, expectancy, 90% ranges, win rate, target capture and estimated net results.Actual Journal screen · click to enlarge

Compare setups without false precision.

Put strategy expectancy ranges on a shared scale, with trade counts, win rate and net results. Overlapping ranges share a rank; small samples stay unranked.

In your review

A higher average is a starting point for investigation. The range and sample size show how much the ranking can tell you.

View app screen
12 / Edge decay analysis#
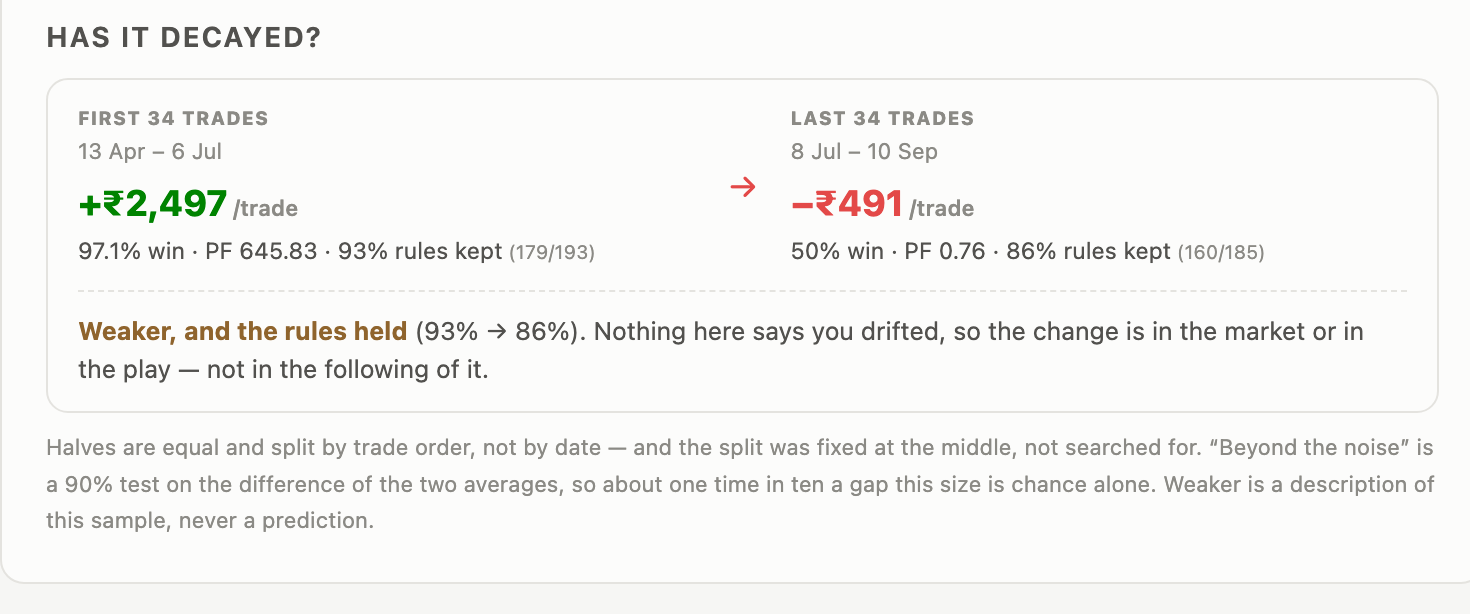
Actual Edge Decay analysis comparing the first and last 34 Opening drive trades, with expectancy, win rate and rule adherence for each period.Actual Journal screen · click to enlarge

Check whether the edge still holds.

Compare earlier and later trades alongside rule adherence. See whether a change in average results is larger than the sample’s noise, and whether your discipline changed too.

In your review

Review changing results and changing behaviour together before deciding that a strategy has weakened.

View app screen
13 / What-if Lab#
YOUR RECORDED HISTORYChoose a slice to excludeWeekday · entry hour · instrument · grade · setupScenarioBaselineFeature illustration

Turn a hunch into a question you can inspect.

Exclude a slice of your history by weekday, entry hour, instrument, grade, setup or symbol. Compare the remaining trades with your original baseline.

In your review

This is a counterfactual view of recorded trades. It helps investigate a habit; it does not predict future results.

View app screen
14 / Multiple accounts & export#
Account AAccount BAccount COne journal. Your context.Review separately or togetherExport your journal ↓Feature illustration

Keep the whole record in your hands.

Label trading accounts and review them separately or together. Keep the notes and attachments that explain the trades, and download an export of your journal.

In your review

Account capacity depends on your plan. Export lets you retain a copy of the record you have built.

15 / Weekly review#
YOUR WEEKLY REVIEWMONResultsRisk + adherencePreview in settingsOpt in with a verified email addressFeature illustration

Give reflection a regular place in your week.

Preview a digest of your results and adherence in settings. Opt into Monday email delivery with a verified email address to review the week that just finished.

In your review

A week with no closed trades sends no digest. Start with the preview to see exactly what would be included.

CLEAR ABOUT WHAT IS HERE

Built today. Room to grow.

The features above are implemented in the Journal; availability may depend on your plan. Perch is free during beta.

Broker auto-sync, AI Review, standalone market charts, Trade Replay and fill charts are planned. Feature illustrations explain the workflow; linked app screenshots show the existing interface and figures as captured.

See plans and availability →
START WITH YOUR OWN RECORD

Your next review
starts with one trade.

Bring a supported tradebook, add a trade manually or explore sample data.

Start journaling free No payment details required during beta.

Journal screen

Actual app screen · figures shown as captured.Open full size ↗